![]()
Closer look at what’s happening (or not happening as a matter of fact):
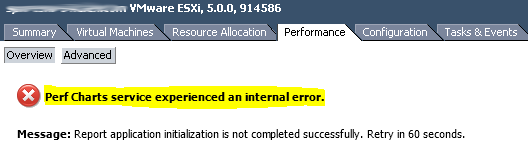
Now, this error has been around for as long as I can remember. There are many causes of it but I will try to cover the one I have experienced (and solved)
Let’s get to it.
In vCenter 4.x this has never been an issue and charts stopped working since I have upgraded my vCenter to version 5.0 Update 2. Generally you look at log files for vCenter (stats.log is what we’re after) to determine the root cause. Location of stats.log depends on version of Windows and its as follows:
1) For Windows prior to Vista/7: C:\%ALLUSERSPROFILE%\Application Data\VMware\VMware VirtualCenter\Logs\
2) For Windows Vista/7 and up: C:\%ALLUSERSPROFILE%\VMware\VMware VirtualCenter\Logs\
My log file had some pretty obvious clues what the problem was:
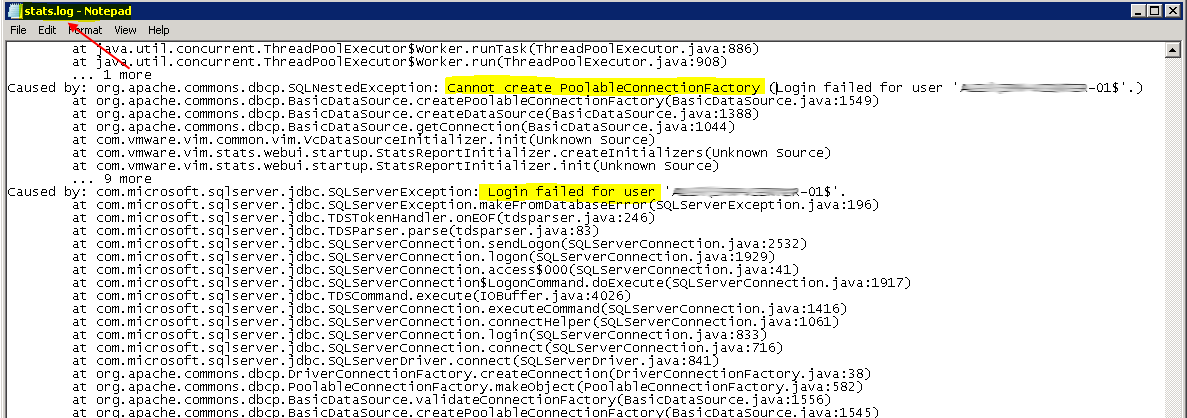
“com.microsoft.sqlserver.jdbc.SQLServerException”
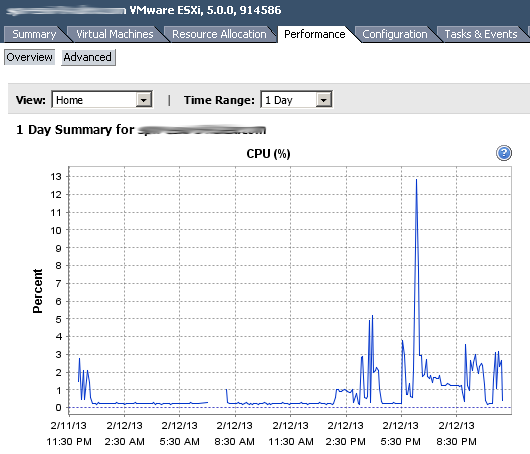
Basically as I was using remote SQL database my vCenter computer account didn’t have enough permission (as in administrative rights) on my SQL box hence the failed logins. This was never the case in 4.x though as my charts were absolutely fine! Anyway, once computer account was added to local administrators and VMware VirtualCenter Management Webservices restarted charts resurrected themselves!
Nothing beats troubleshooting technical issues at midnight – I’m telling you!